II. El mapa y la superposición
Siempre me han obsesionado los mapas. He pasado incontables horas de mi vida mirándolos y descubriéndolos. Y por eso desde que tengo uso de razón recuerdo haber observado mapas de Palestina, Israel, Tierra Santa o como sea que se le llamara en cada ocasión. Como parte del llamado Creciente Fértil en que se inició la ganadería y la agricultura, estas tierras acumulan capas y capas de civilizaciones superpuestas. Por su estratégica ubicación entre Europa, África y Asia y por ser un punto de encuentro entre la zona del mediterráneo y las rutas que lo comunican con el oriente, estas tierras han sido por siglos fortaleza y lugar de paso. Por poseer lugares santos y reliquias de las tres religiones abrahánicas o semíticas ―judaísmo, cristianismo e islam―, estas tierras ocupan un lugar simbólico que las ha llevado a ser prolíficamente veneradas, representadas e imaginadas, pero también disputadas, profanadas y repartidas como si de un botín se tratara. Por lo mismo, cuesta pensar que exista otro lugar del mundo al que se le hayan dedicado más mapas a lo largo de la historia. Baste pensar en la enorme cantidad de biblias cristianas que incluyen mapas de la «tierra santa» durante el antiguo y nuevo testamento.
Un mapa de Palestina del siglo XIX es el punto de partida de 1880/2015, uno de los trabajos que componen la muestra Sin tierra, que Rafael Guendelman Hales presenta en el Museo de la Solidaridad Salvador Allende en Santiago y en el Parque Cultural de Valparaíso. El artista tomó un conocido mapa de Palestina de 1880, antes de la primera inmigración sionista de 1882, y lo superpuso ―ayudado por Google Maps― con otros mapas que indicaban los poblados y asentamientos judíos y palestinos anteriores a tal inmigración, así como también los actuales. La comparación entre estos últimos dos resulta reveladora del impresionante aumento de la población judía y de su expansión territorial, que como contraparte ha significado una condensación radical de la población palestina a Gaza y ciertas zonas Cisjordania.
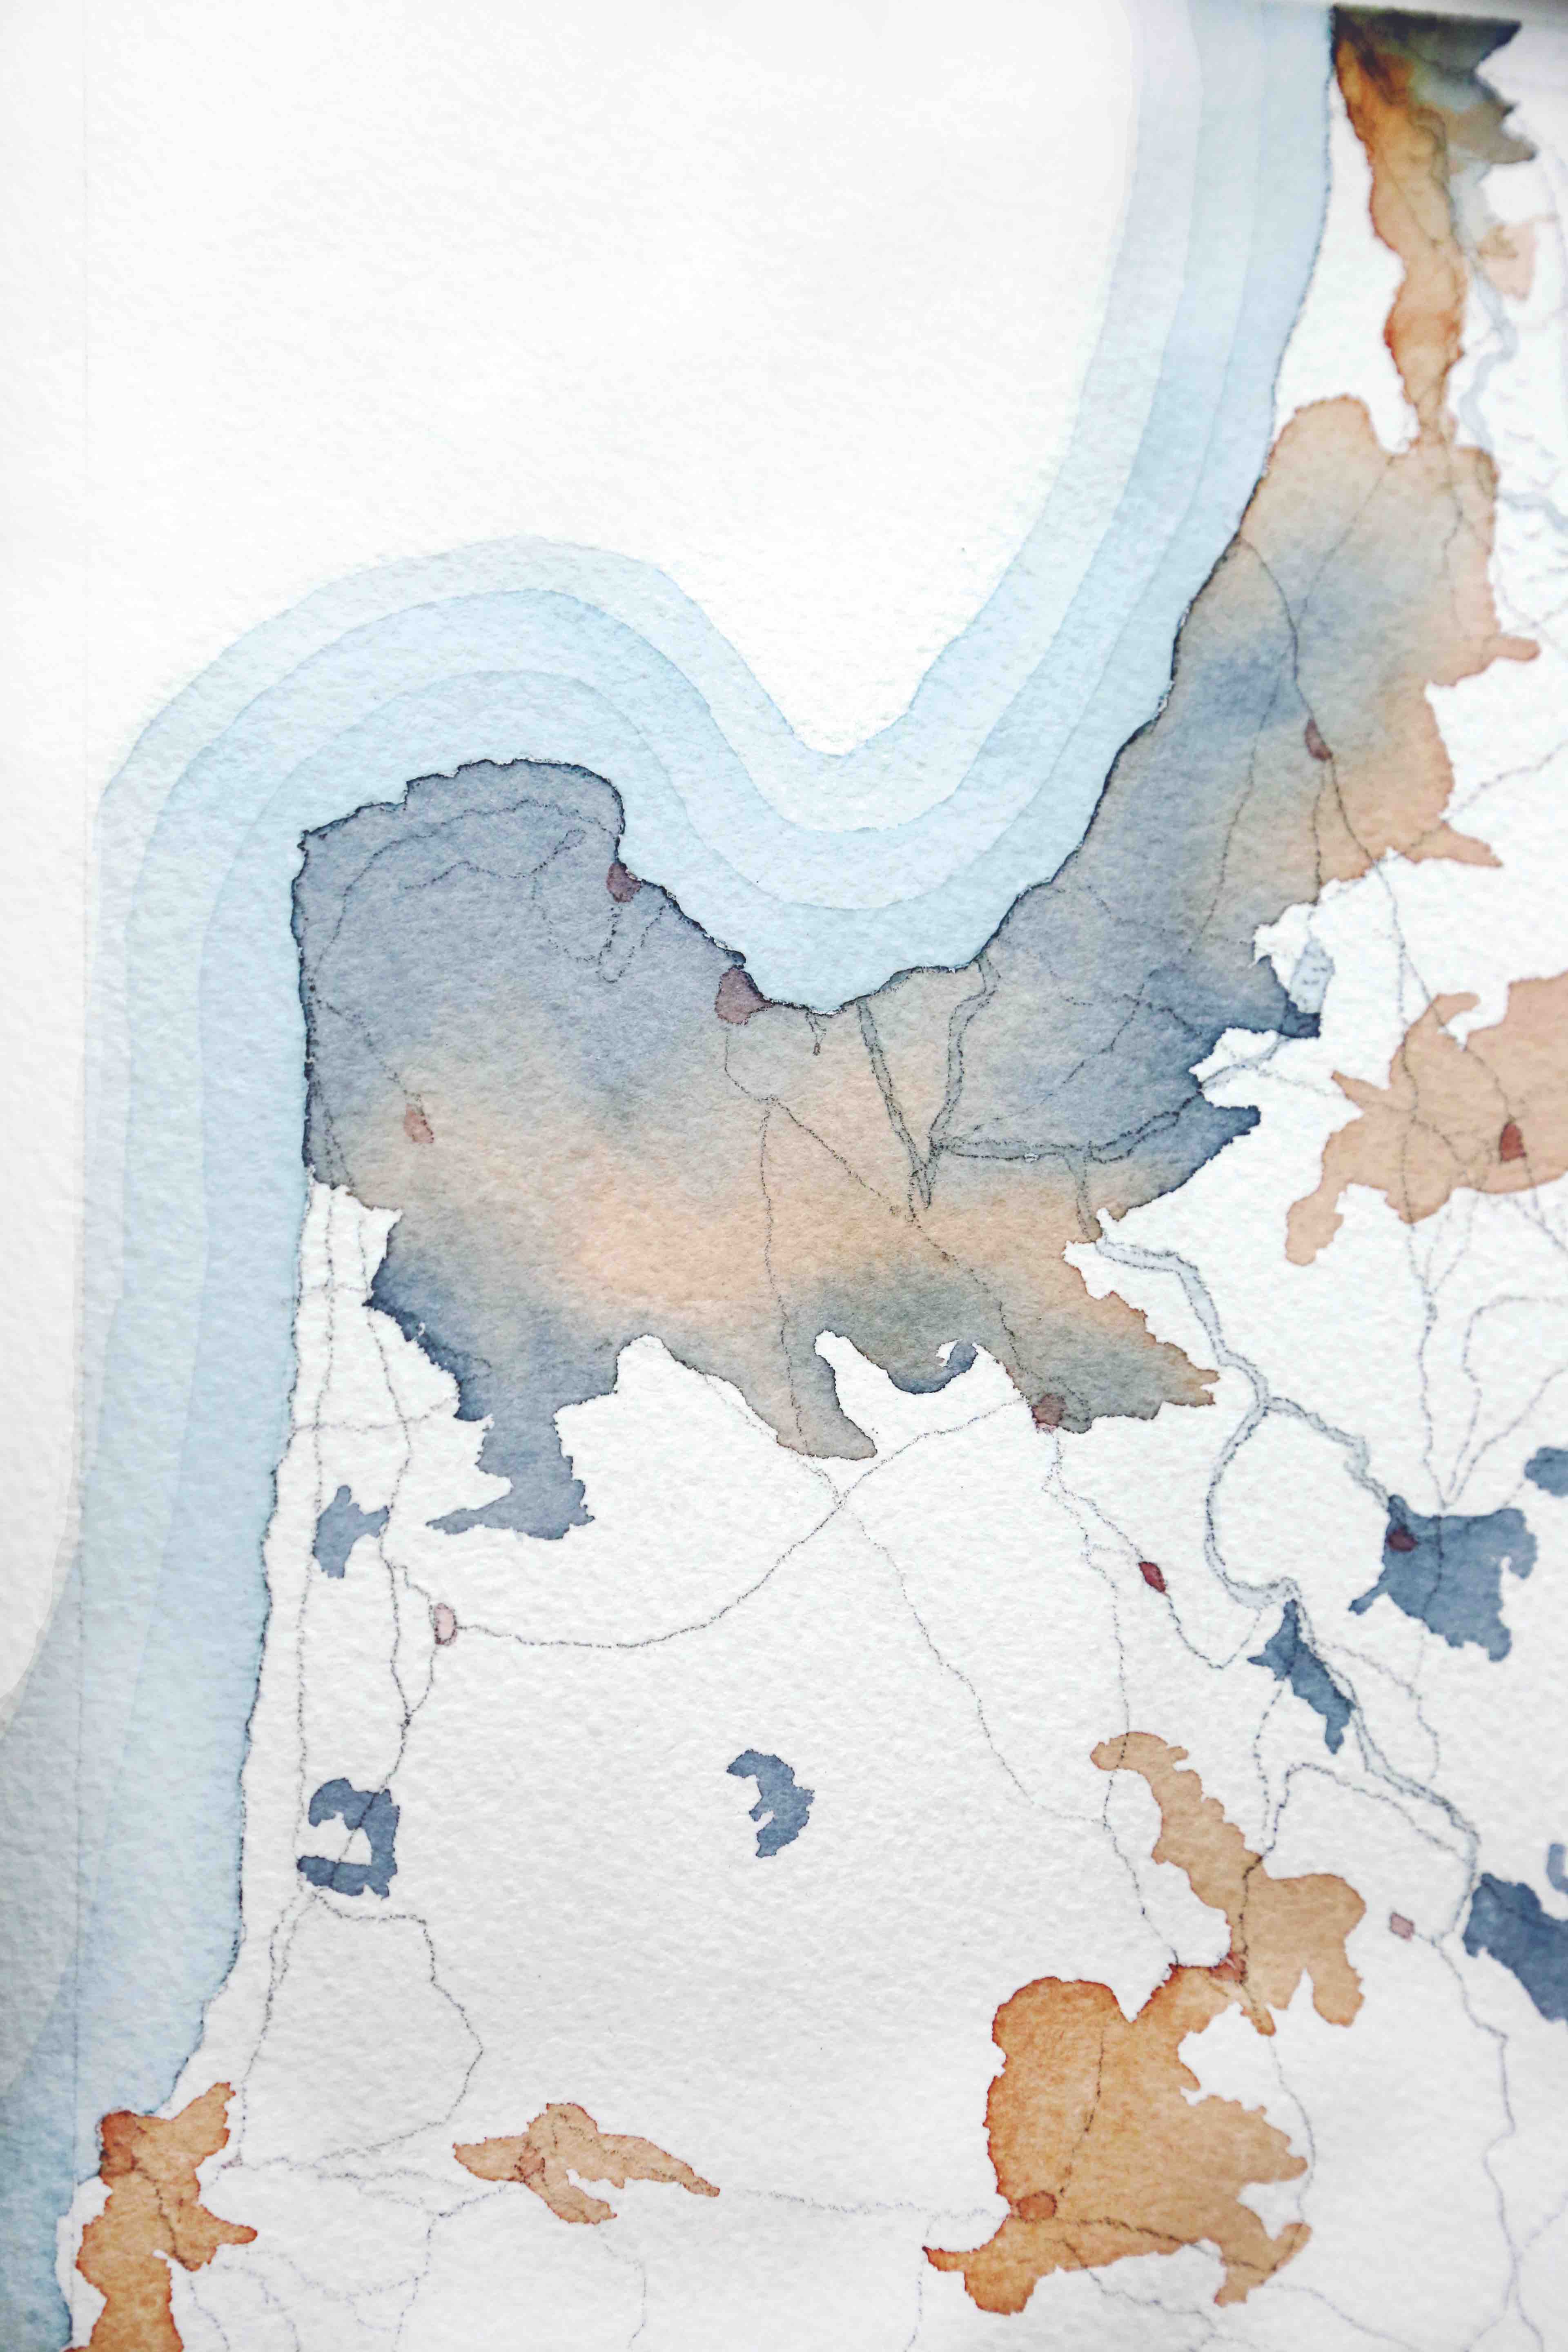
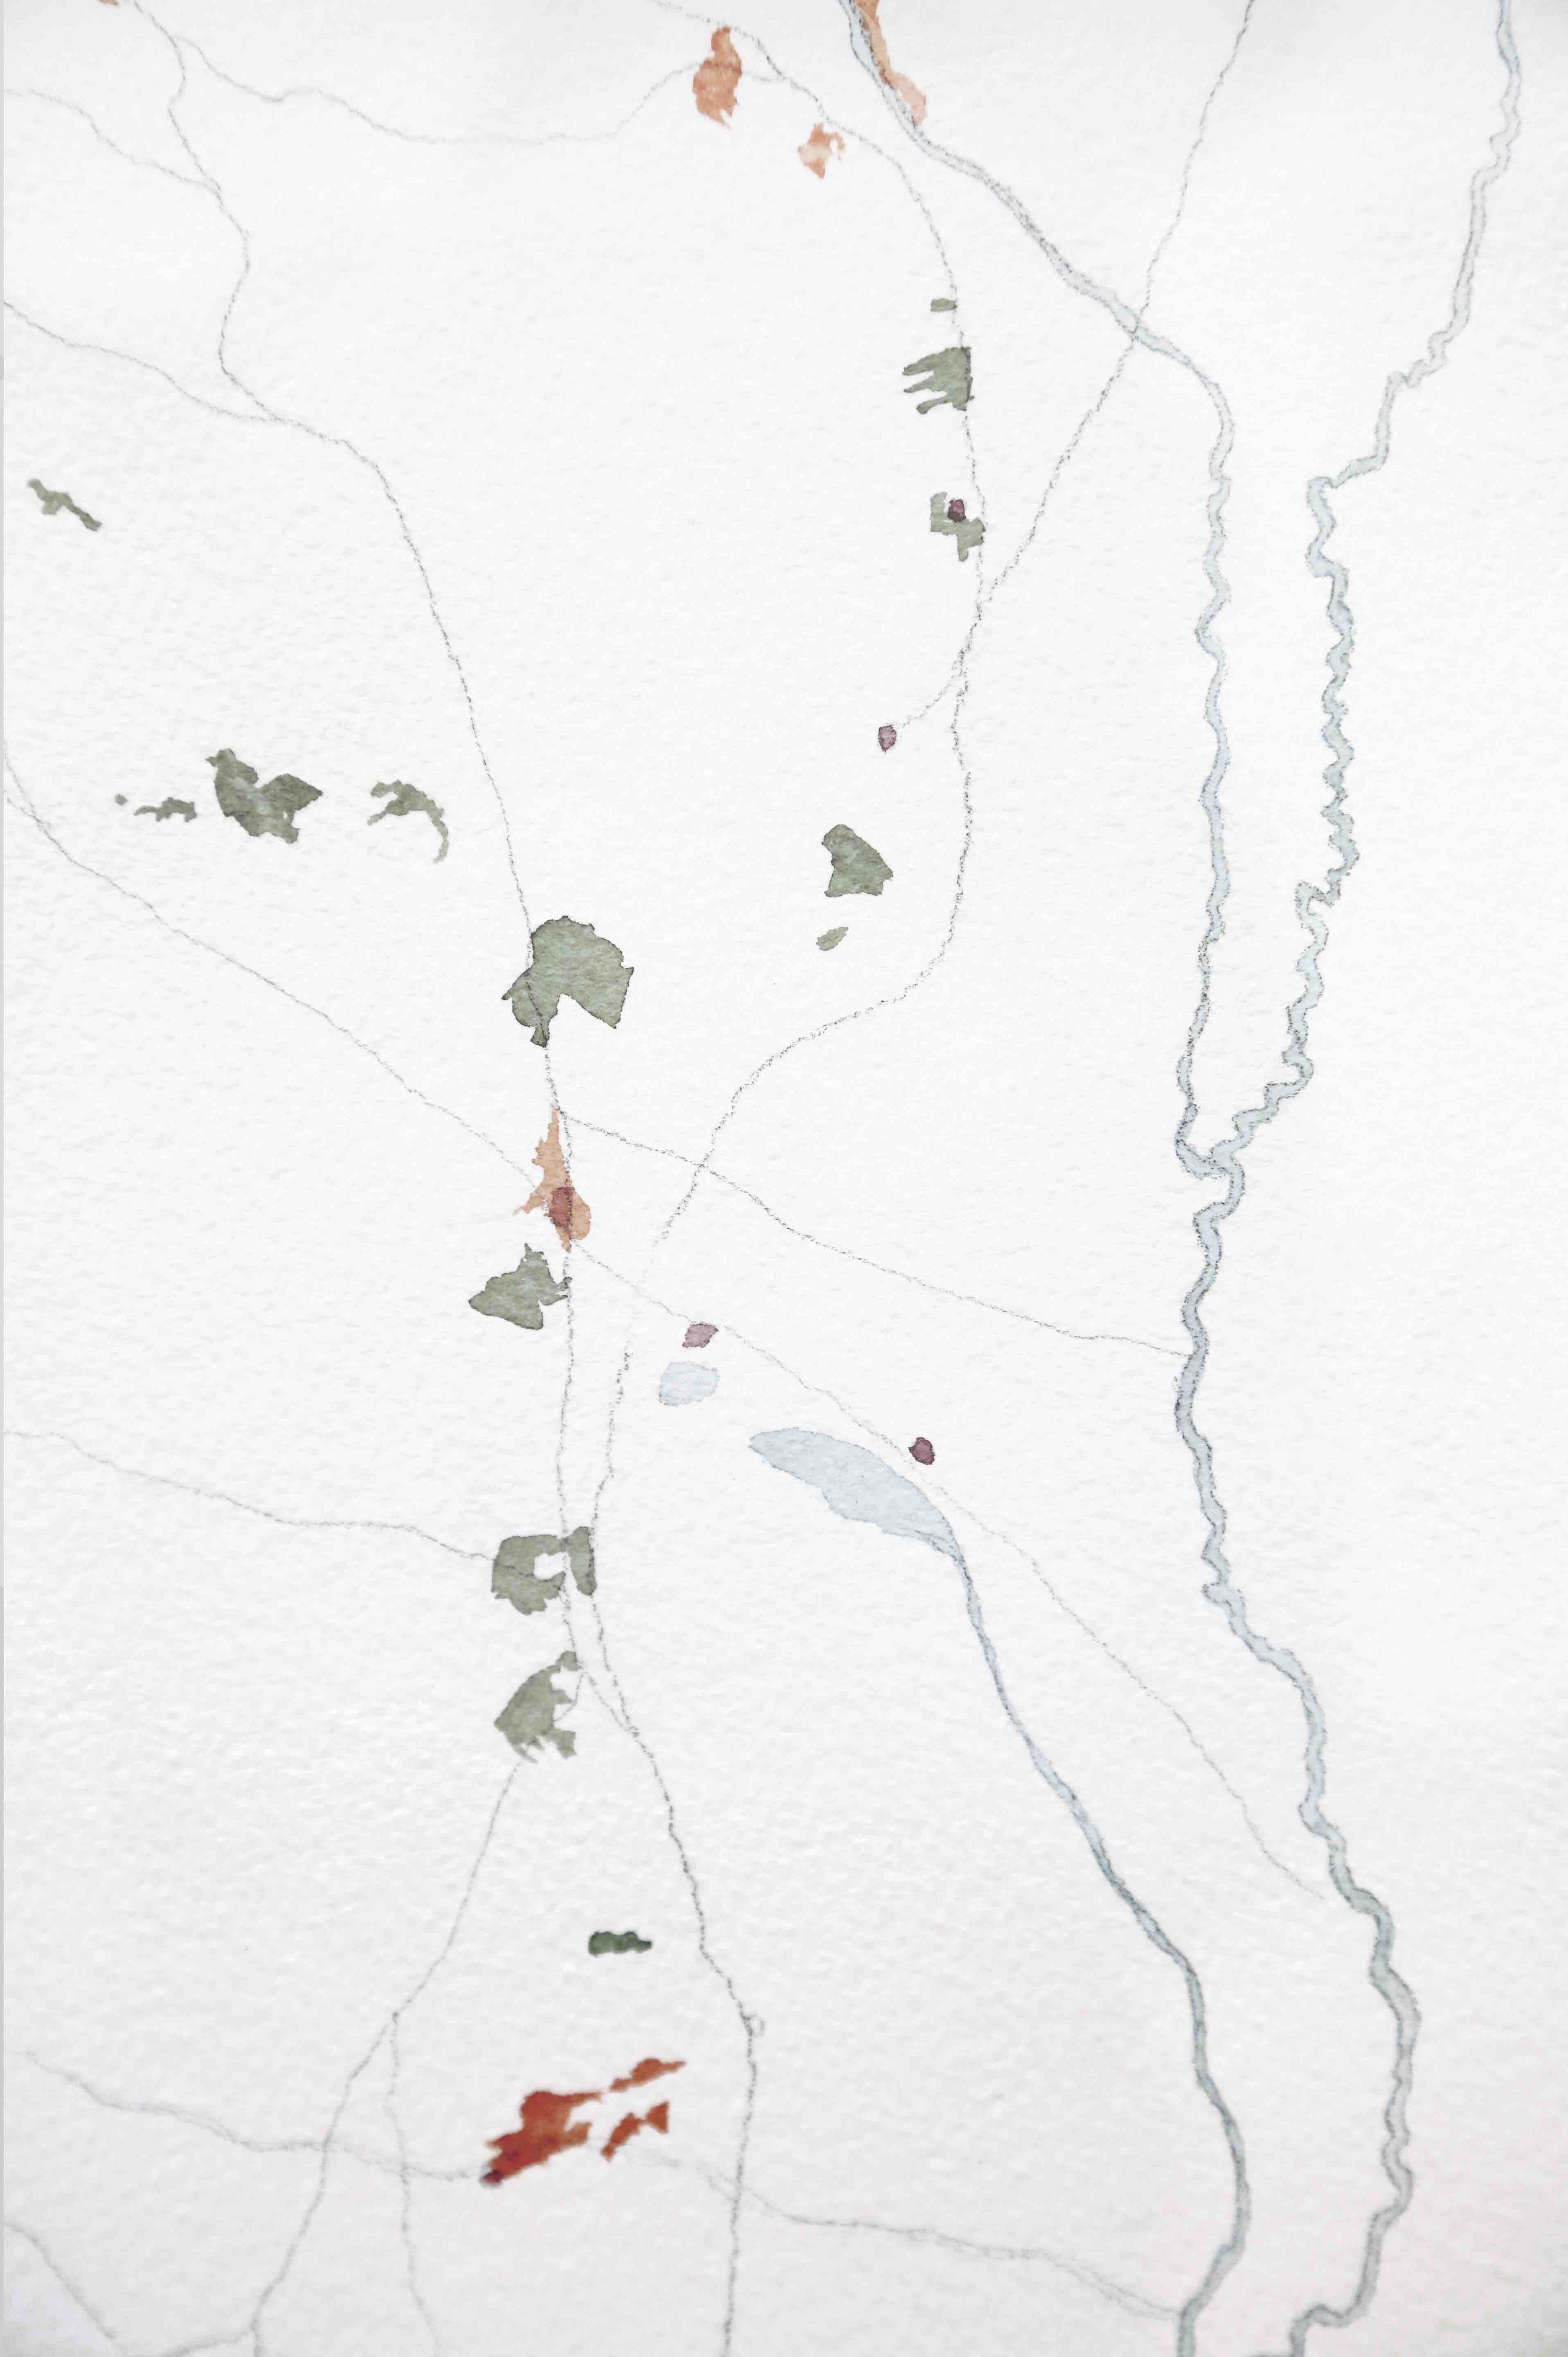
Como una suerte de solución de continuidad entre estas realidades gráficas antagónicas y superpuestas, Guendelman recreó en acuarela el mapa original en escala 1:1 (éste consta de veintiséis láminas que cubren una superficie 2,8 por 1,6 metros) y tradujo a colores los diversos asentamientos y poblados, según si eran palestinos o judíos y actuales o anteriores a 1982. Lo intrincado de la superposición resultante sumado a las propiedades de la acuarela determinaron una suerte de superficie de colores abstracta en la que los tonos tienden a expandirse y mezclarse, que cubre con mayor densidad el mapa justamente donde existe una mayor concentración de población. Los asentamientos humanos permanecen, deben desplazarse, fundirse o encapsularse por razones diversas y complejas, desde medioambientales a políticas. En la acuarela, esa complejidad histórica aparece cifrada en ese azar controlado que determina la expansión de los colores. El artista ya había experimentado con una técnica similar en una serie de vistas de Palestina del año 2012, pero con resultados diferentes, pues en esa ocasión el medio fue el esmalte sintético.
1880/2015 es y no es mapa. Representa un territorio, una porción de la superficie de la tierra y su historia política es el referente. Pero no nos sirve como esperaríamos que un mapa de este tipo nos sirviera. Como instrumento de información y propaganda, es críptico y sistemáticamente inexacto. Realiza la representación territorial a través del azar y la manualidad en un mundo en que esta transita del GPS a Google Earth. Tampoco podríamos decir que es un artefacto decorativo, pues nunca llega a liberarse la forma de los mapas contingentes que le dieron origen. Pero es probable que por ser un artefacto de difícil clasificación, este mapa de Guendelman constituya un dispositivo reflexivo de los límites y significados de una representación geográfica y técnica del mundo que se nos ha vuelto cotidiana (en los celulares, en Google Street View), y que tiene como telón de fondo una serie de conflictos geopolíticos que han sobrevivido y aún se han multiplicado tras el supuesto fin de los grandes relatos que alguien decretó hace tres décadas.
II. Maps and superpositions
I’ve always been obsessed with maps. Innumerable hours of my life have been spent observing and discovering them. And that is why, since as far back as I can remember, I can recall having observed maps of Palestine, Israel, the Holy Land, or however it was called on each occasion. As part of the Fertile Crescent, where agriculture and livestock farming first began, these territories accumulate layers and layers of superimposed civilizations. Because of its strategic location between Europe, Africa, and Asia, and for being a meeting point between the Mediterranean and the routes that led towards the East, these lands have been fortresses and passing points for centuries. Due to the existence of holy places and relics for the three Abrahamic or Semitic religions —Judaism, Christianity, and Islam—, these lands occupy a symbolic place that has led them to be profoundly revered, represented, and imagined, yet also contested, profaned and divided as if they were spoils to be plundered. For this same reason, it is difficult to think of another place in the world that has had more maps drawn out for it throughout history. One only needs to think of the enormous quantity of Christian Bibles that include maps of the Holy Land in its Old and New Testaments.
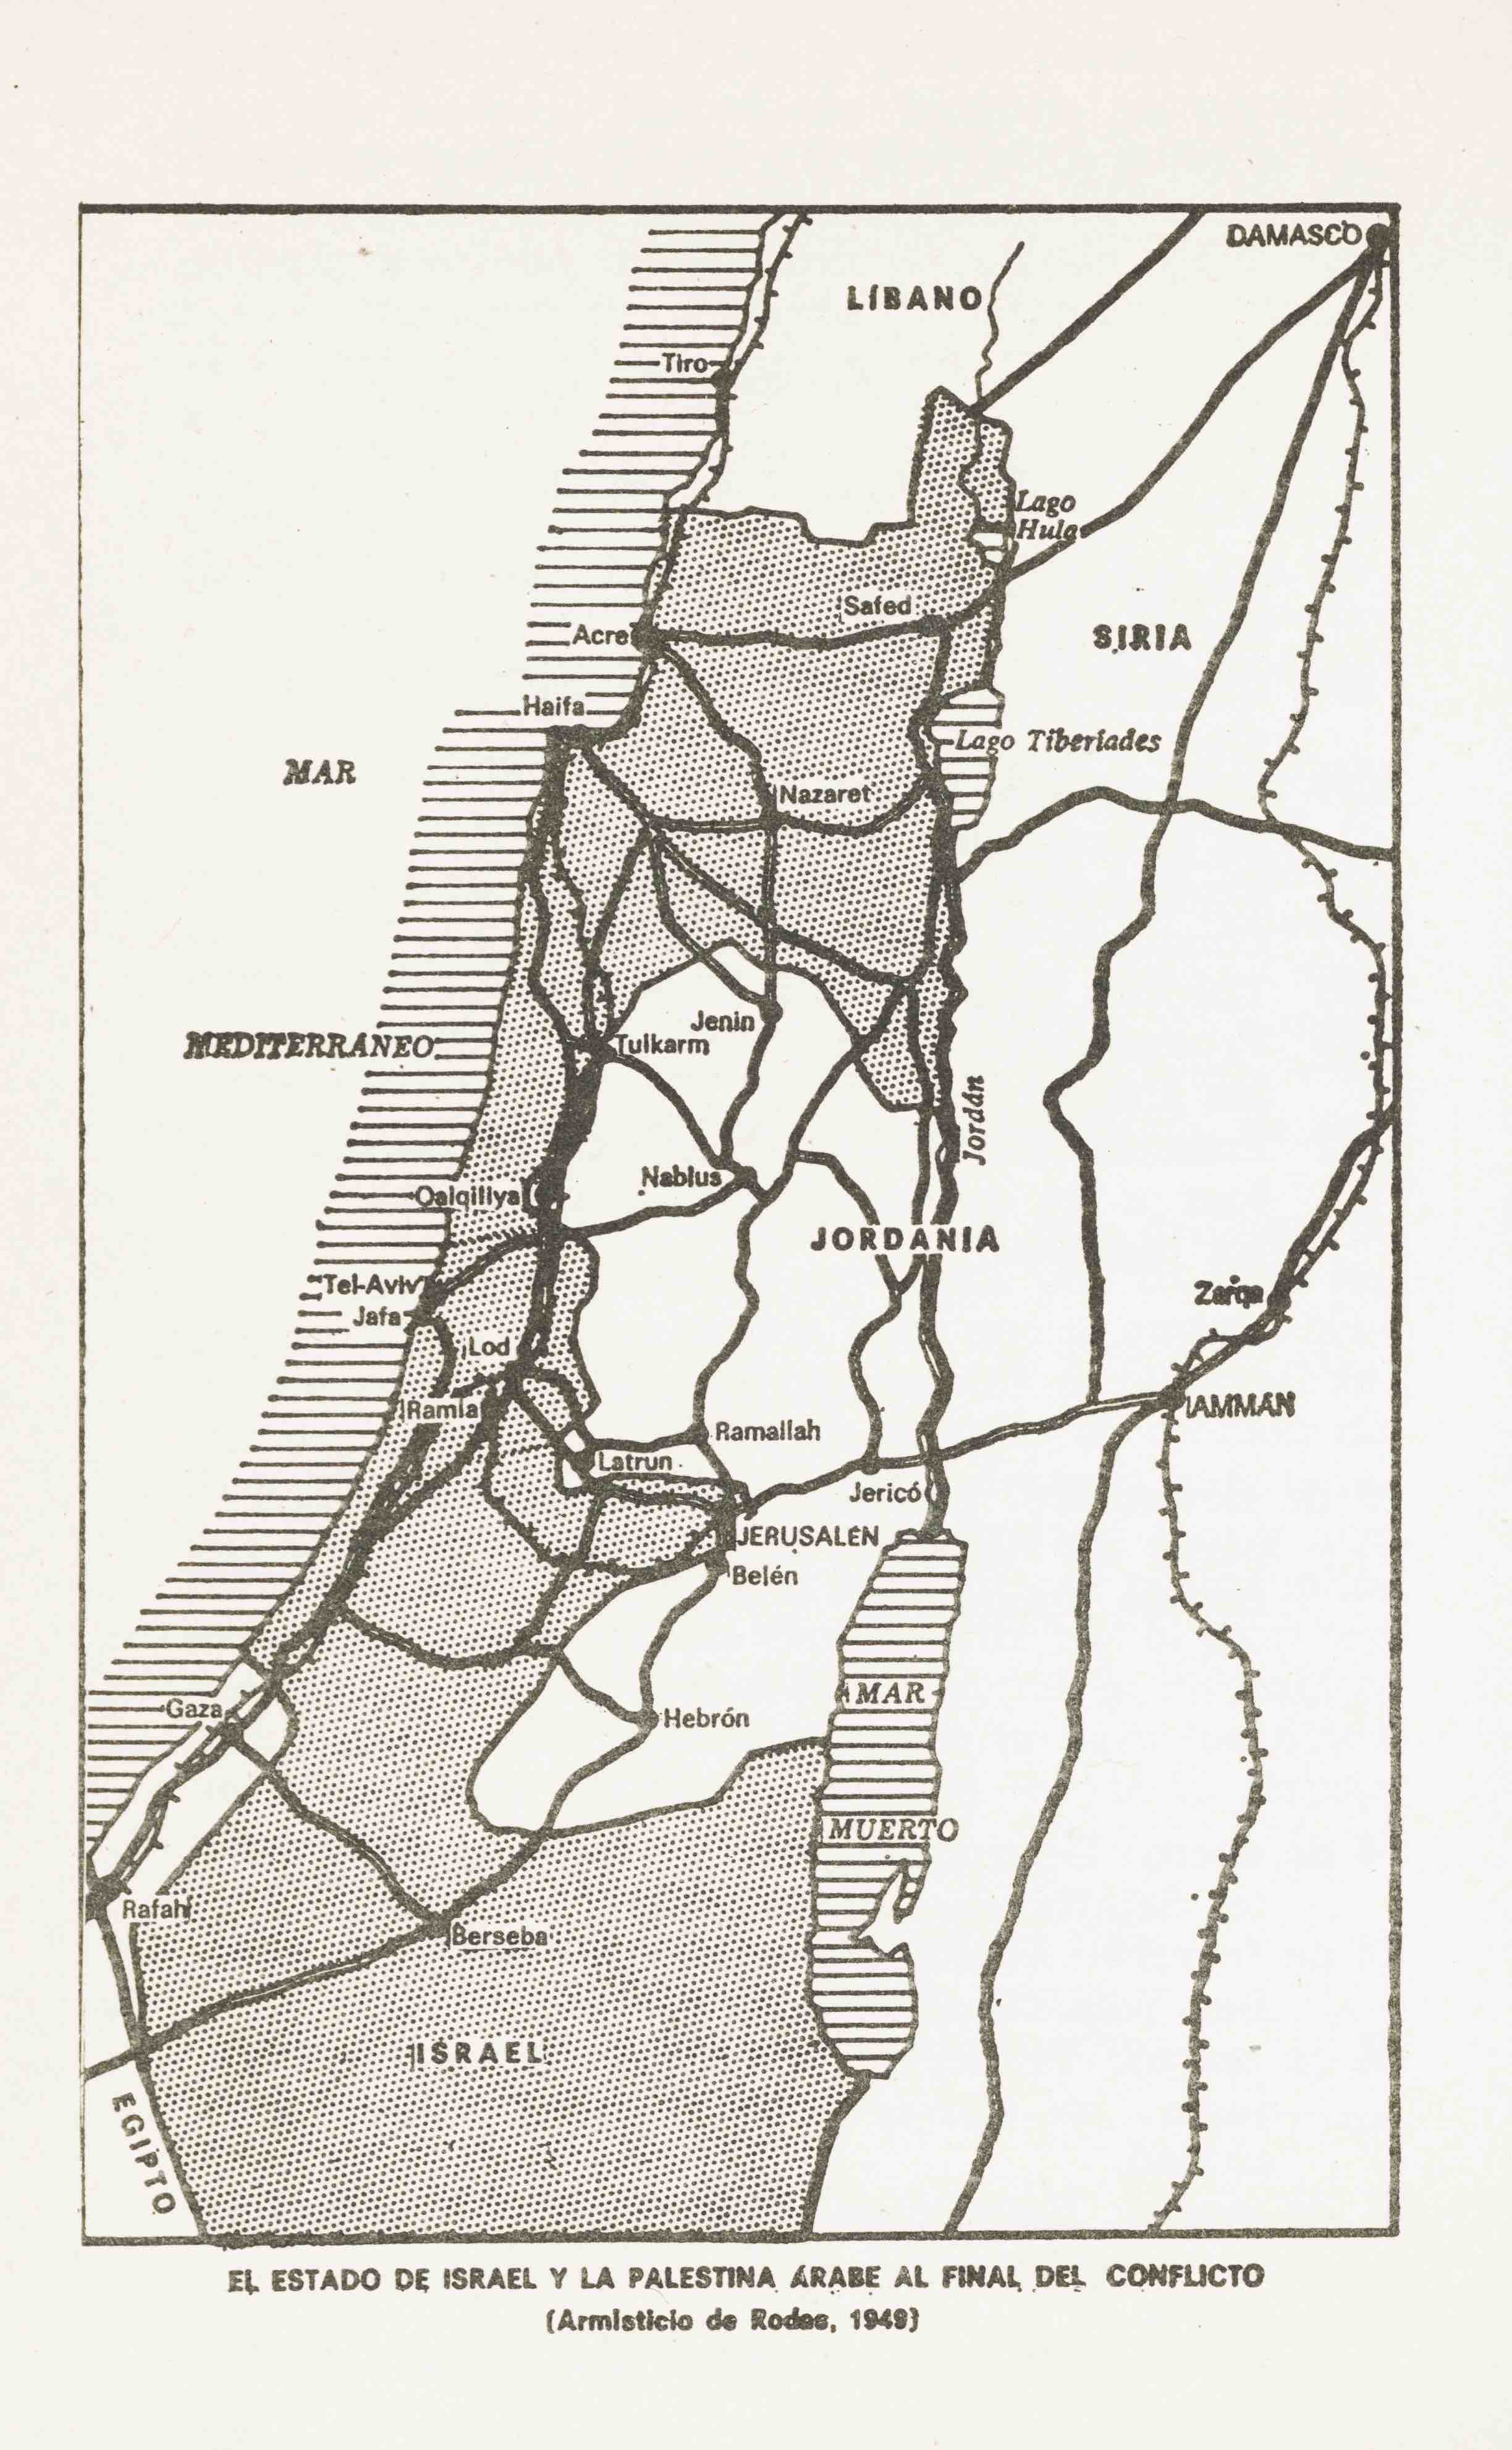
A map of Palestine during the XIX century is the starting point for 1800/2015, one of the pieces that forms part of No Land, the exhibition that Rafael Guendelman Hales has mounted at the Museo de la Solidaridad Salvador Allende in Santiago and at Parque Cultural in Valparaiso. The artist took a well-known map of Palestine in 1880, before the first wave of Zionist immigration in 1882, and superimposed it —with the help of Google Maps— with other maps that indicated Jewish and Palestinian towns and settlements prior to the immigration, as well as those that exist currently. The comparison between these last two reveals the impressive increase and territorial expansion of the Jewish population, which in turn, has led to a radical condensation of the Palestinian population in Gaza and certain areas of the West Bank.
As a solution of sorts for the continuity between these antagonistic and superimposed graphic realities, Guendelman recreated the original map in watercolor on a 1:1 scale (this consists in twenty-six pages that cover a surface of 2.8x1.6 meters) and translated the diverse settlements and towns into colors, according to whether they were Palestinian or Jewish and whether they were current or prior to 1882. The intricateness of the resulting superimposition, along with the properties of watercolor, resulted in an abstract colored surface in which tones tend to expand and combine, covering the map more densely exactly where there is a higher density of population. The human settlements remain, travel, merge or are encapsulated by diverse and complex reasons, from environmental to political. In the watercolor painting, this historical complexity appears to be encrypted in the controlled randomness that determines the expansion of colors. The artist had already experimented with a similar technique during a series of visits to Palestine in 2012, but with different results, since on that occasion the medium was synthetic enamel.
1880/2015 is and isn’t a map. It represents a territory, a portion of the earth’s surface, and refers to its political history. But it cannot be used as we would expect to use a map of this kind. As an instrument for information and propaganda, it is cryptic and systematically inexact. Its territorial representation is manufactured at random and by hand, in a world in which this is done through GPS and Google Earth. Nor could we say that it is a decorative artifact, for its form never frees itself from the contingent maps that originated it. Because this artifact’s classification is difficult, it is likely that Guendelman’s map constitutes a device that reflects on the borders and meanings of a geographical and technical representation of the world that has become familiar to us (on cell phones, on Google Street View), and which lies before a backdrop of geopolitical conflicts that have survived and even multiplied after the supposed end of great tales that someone decreed three decades ago.